On this page
- What does the iron-carbon phase diagram represent?
- What are the single-phase fields in the iron-carbon diagram?
- What are the critical transformation lines in the iron-carbon phase diagram?
- How do you read an iron-carbon phase diagram step by step?
- How does the iron-carbon diagram’s eutectoid classification determine steel microstructure?
- How do you calculate phase fractions using the lever rule on an iron-carbon diagram?
- What microstructures form in common carbon steels upon slow cooling?
- How do alloying elements like manganese affect the iron-carbon phase diagram?
- What does the iron-carbon phase diagram predict for cast iron microstructures?
- What are the practical limitations of the iron-carbon equilibrium diagram?
- How is the iron-carbon phase diagram used for heat treatment planning?
- Key takeaways
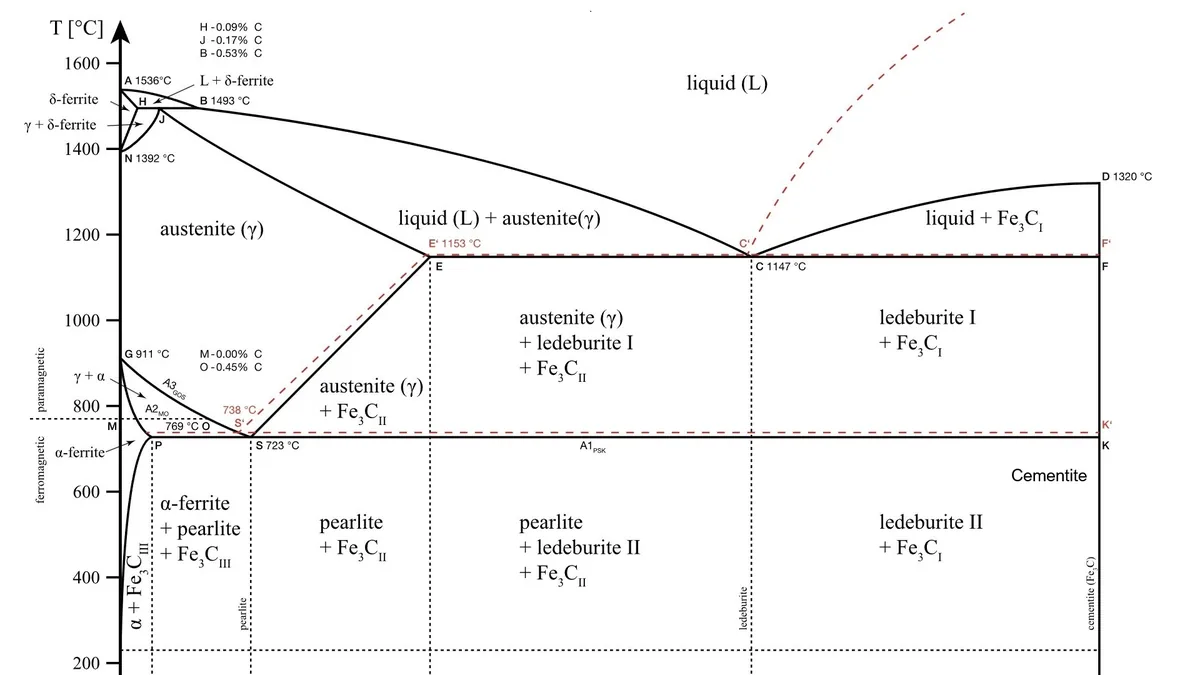

What does the iron-carbon phase diagram represent?#
The iron-carbon phase diagram (specifically the metastable Fe-Fe3C system) shows which phases are stable at equilibrium for any temperature and carbon content from 0 to 6.67 wt%. It uses phase boundaries and invariant reactions to predict whether an alloy is ferritic, austenitic, liquid, or a mixture, forming the foundation for heat treatment and solidification analysis.
In industrial practice, you rarely work beyond about 4.5% carbon, which covers the full range of cast irons. The diagram assumes slow heating or cooling that maintains equilibrium, meaning diffusion is complete. Real processes like quenching or welding violate this, but the equilibrium diagram still tells you the starting state and the driving forces for transformation.
The diagram plots temperature on the vertical axis against carbon content on the horizontal axis. Lines on the diagram, called phase boundaries, mark where a phase appears, disappears, or begins a transformation. Understanding a few key boundaries unlocks the whole system.
What are the single-phase fields in the iron-carbon diagram?#
The iron-carbon phase diagram contains five principal single-phase fields: ferrite (α, BCC), austenite (γ, FCC), δ-ferrite (BCC), cementite (Fe3C), and liquid. Each field represents a temperature-composition region where only one phase is stable, defining the solubility limits and crystal structures of iron and carbon.
- Ferrite (alpha-Fe, BCC): Exists at low temperatures and low carbon content, with a maximum carbon solubility of only 0.022% at 727°C. It is soft and magnetic.
- Austenite (gamma-Fe, FCC): Exists at elevated temperatures, typically above 727°C for plain carbon steels. It can dissolve up to 2.14% carbon. It is non-magnetic and is the parent phase for most heat treatment transformations.
- Delta-ferrite (delta-Fe, BCC): Appears at very high temperatures near the melting point in low-carbon alloys. It has the same BCC crystal structure as alpha-ferrite but is rarely retained in room-temperature microstructures of plain carbon steels.
- Cementite (Fe3C): A hard, brittle intermetallic compound containing 6.67% carbon. It appears as a stoichiometric vertical line on the diagram because it has a fixed composition.
- Liquid (L): Present above the melting temperatures. The liquidus line marks where solidification begins on cooling; the solidus line marks where solidification is complete.
What are the critical transformation lines in the iron-carbon phase diagram?#
The iron-carbon diagram contains three horizontal invariant reactions: the peritectic at 1495°C, the eutectic at 1148°C, and the eutectoid at 727°C. The A1, A3, and Acm phase boundaries intersect these lines, defining the transformation temperatures that govern steel and cast iron solidification and solid-state changes.
- Peritectic at 1495°C: Liquid (0.53% C) + delta-ferrite (0.09% C) transforms to austenite (0.17% C). This reaction is important for solidification of low-carbon steels but is rarely a focus for downstream heat treatment.
- Eutectic at 1148°C: Liquid (4.30% C) transforms to austenite (2.14% C) + cementite. This reaction defines the solidification of cast irons. The resulting eutectic mixture is called ledeburite.
- Eutectoid at 727°C: Austenite (0.76% C) transforms to ferrite (0.022% C) + cementite. This is the single most important reaction in steel metallurgy. The eutectoid mixture is called pearlite, a lamellar structure of ferrite and cementite that gives steel its balance of strength and toughness.
The A1, A3, and Acm lines are the phase boundaries that intersect these horizontal lines. The A1 line is the eutectoid temperature itself. The A3 line separates the austenite field from the austenite+ferrite two-phase field. The Acm line separates austenite from the austenite+cementite field. On heating, these boundaries shift slightly upward; the equilibrium diagram shows the cooling transformation temperatures, strictly called Ar1, Ar3, and Arcm, but the equilibrium values are the standard reference.
How do you read an iron-carbon phase diagram step by step?#
To read the iron-carbon diagram, locate the alloy’s carbon content on the horizontal axis, draw a vertical line up, then find the intersection with the temperature of interest. If the point falls in a single-phase field, the alloy is that phase; if in a two-phase field, identify the phases and apply the lever rule to calculate proportions.
- Locate the alloy composition on the horizontal axis. For a 1045 steel, find 0.45% carbon.
- Draw a vertical line upward from that composition. This is your composition line for all temperatures.
- Identify the temperature of interest on the vertical axis. Draw a horizontal line at that temperature. The intersection with the composition line tells you which phase field you are in.
- If the point falls in a single-phase field, the alloy is 100% that phase. The composition of the phase is the alloy composition.
- If the point falls in a two-phase field, identify the two phases from the surrounding fields. Use the tie line and lever rule to calculate the fraction and composition of each phase.
How does the iron-carbon diagram’s eutectoid classification determine steel microstructure?#
The eutectoid reaction at 727°C and 0.76% C divides steels into hypoeutectoid (proeutectoid ferrite + pearlite), eutectoid (100% pearlite), and hypereutectoid (proeutectoid cementite + pearlite). These categories predict the equilibrium microstructure after slow cooling, directly influencing hardness, ductility, and subsequent heat treatment response.
- Eutectoid steel (0.76% C): On cooling from the austenite field to just below 727°C, all austenite transforms directly to pearlite. The microstructure is 100% pearlite.
- Hypoeutectoid steel (<0.76% C): On cooling, the alloy first crosses the A3 line and enters the austenite+ferrite field. Proeutectoid ferrite nucleates and grows along prior austenite grain boundaries. The remaining austenite becomes enriched in carbon until it reaches 0.76% at 727°C, at which point it transforms to pearlite. The final microstructure is proeutectoid ferrite grains plus pearlite.
- Hypereutectoid steel (>0.76% C): On cooling, the alloy first crosses the Acm line and enters the austenite+cementite field. Proeutectoid cementite forms along austenite grain boundaries. The remaining austenite reaches 0.76% carbon and transforms to pearlite. The final microstructure is a network of cementite surrounding pearlite colonies. This cementite network makes hypereutectoid steels brittle unless broken up by forging or heat treatment.
This sequence is the basis for understanding steel heat treatment. Annealing, normalizing, and hardening all start by heating into the austenite field and controlling the cooling path from there. See Steel Heat Treatment: Processes, Microstructures, and Properties.


How do you calculate phase fractions using the lever rule on an iron-carbon diagram?#
The lever rule calculates weight fractions of two coexisting phases in the iron-carbon diagram by drawing a horizontal tie line across the two-phase field, reading phase compositions at the boundaries, and applying the mass balance: fraction of left phase = (C_right − C_alloy)/(C_right − C_left).
The lever rule is a mass balance calculation that works in any two-phase region of a binary phase diagram. It answers: how much of each phase is present, and what is the composition of each phase?
Procedure for the lever rule#
- At the temperature of interest, draw a horizontal tie line across the two-phase field. The tie line connects the two phase boundaries on either side.
- The composition of each phase is read directly from the intersection of the tie line with the phase boundary. The left intersection gives the composition of the phase on the left (for example, ferrite), and the right intersection gives the composition of the phase on the right (for example, austenite).
- To calculate the weight fraction of the left-side phase, measure the length of the tie line segment from the alloy composition to the right boundary, and divide by the total tie line length. Formally: W_left = (C_right - C_alloy) / (C_right - C_left).
- The weight fraction of the right-side phase is W_right = (C_alloy - C_left) / (C_right - C_left), or simply 1 - W_left.
Worked example of the lever rule#
Consider a 0.4% carbon steel at 800°C. This falls in the austenite+ferrite two-phase field.
- The tie line at 800°C intersects the ferrite boundary at approximately 0.02% C and the austenite boundary at approximately 0.60% C. (Exact values depend on the specific diagram version; use the numbers from your reference diagram.)
- C_left (ferrite) = 0.02%, C_right (austenite) = 0.60%, C_alloy = 0.40%.
- Fraction ferrite = (0.60 - 0.40) / (0.60 - 0.02) = 0.20 / 0.58 ≈ 0.345, or 34.5%.
- Fraction austenite = (0.40 - 0.02) / (0.60 - 0.02) = 0.38 / 0.58 ≈ 0.655, or 65.5%.
Just above the eutectoid temperature of 727°C, that same 0.4% C steel has ferrite at 0.022% C and austenite at 0.76% C. The fraction of austenite is (0.40 - 0.022)/(0.76 - 0.022) ≈ 0.512, or 51.2%. That austenite will transform entirely to pearlite on cooling below 727°C, so the room-temperature microstructure will be approximately 48.8% proeutectoid ferrite and 51.2% pearlite by weight.
What microstructures form in common carbon steels upon slow cooling?#
Under slow cooling near equilibrium, hypoeutectoid steels produce ferrite and pearlite in proportions determined by carbon content, eutectoid steel is entirely pearlite, and hypereutectoid steels contain pearlite with a grain-boundary cementite network. This predictable sequence, as shown in the phase diagram, is the baseline for all heat treatment alterations.
The phase diagram gives you the equilibrium phases and their proportions, but the microstructure, the arrangement, size, and morphology of those phases, depends on the cooling rate and subsequent processing. For slow cooling (annealing or normalizing), you can predict the microstructure directly from the diagram.
| Steel Grade | Nominal Carbon (wt%) | Classification | Slow-Cooled Microstructure |
|---|---|---|---|
| 1018 | 0.18% | Hypoeutectoid | Mostly ferrite grains with small islands of pearlite (approx. 20% pearlite) |
| 1045 | 0.45% | Hypoeutectoid | Roughly equal proportions of ferrite and pearlite |
| 1080 | 0.80% | Eutectoid | 100% pearlite |
| 1095 | 0.95% | Hypereutectoid | Pearlite with a grain-boundary cementite network |
For a 1018 steel, the low carbon content means the proeutectoid ferrite fraction is high. The pearlite colonies are small and widely spaced. This microstructure yields low hardness (HRB 60-70 as-rolled) but excellent ductility and weldability. For 1095, the continuous cementite network at grain boundaries makes the steel hard but extremely brittle in the as-cast or slow-cooled condition. Spheroidizing annealing, where the steel is held just below the A1 temperature for an extended time, is used to convert the cementite network into isolated spheroids, dramatically improving machinability and cold formability.
How do alloying elements like manganese affect the iron-carbon phase diagram?#
Manganese and other austenite-stabilizing elements lower the A1 and A3 temperatures and shift the eutectoid point to lower carbon contents, altering the apparent phase boundaries. This modifies the carbon equivalent, affecting hardenability, transformation temperatures, and the resulting microstructure in alloy steels and welds.
Most commercial steels contain manganese, typically 0.30 to 0.90%. Manganese is an austenite stabilizer: it lowers the A1 and A3 temperatures and shifts the eutectoid composition to lower carbon contents. A steel with 0.45% carbon and 0.75% manganese behaves like a slightly higher-carbon steel in terms of hardenability and transformation temperatures. When precision matters, you must account for alloying effects using empirical formulas like the carbon equivalent. This is critical in welding, where you need to predict heat-affected zone hardness. For more on alloy effects, see Key Metallurgy Terms Every Engineer Should Know.


What does the iron-carbon phase diagram predict for cast iron microstructures?#
For cast irons, the iron-carbon diagram predicts solidification via the eutectic at 1148°C, yielding hypoeutectic (proeutectic austenite + ledeburite), eutectic (ledeburite), or hypereutectic (proeutectic cementite + ledeburite) structures in white irons. With silicon and slow cooling, the stable Fe-C graphite system applies, producing gray, ductile, or compacted graphite irons.
Above 2.14% carbon, you enter the cast iron domain. The eutectic reaction at 1148°C dominates solidification.
- Hypoeutectic cast iron (2.14 to 4.30% C): Solidification begins with the formation of proeutectic austenite dendrites. The remaining liquid reaches the eutectic composition and solidifies as ledeburite (austenite+cementite). On further cooling, the austenite in the ledeburite transforms to pearlite plus additional cementite.
- Eutectic cast iron (4.30% C): Solidifies entirely as ledeburite.
- Hypereutectic cast iron (4.30 to 6.67% C): Proeutectic cementite forms first, often as large, faceted plates, followed by ledeburite solidification.
The above describes white cast iron, where carbon is locked in cementite. The fracture surface appears white and crystalline. White iron is extremely hard and wear-resistant but brittle, used in mill liners and slurry pump components.
If silicon is present (typically 1 to 3% in cast irons) and the cooling rate is slow, the stable iron-graphite system applies instead. Carbon precipitates as graphite flakes (gray iron), spheroids (ductile iron), or compacted vermicular particles (compacted graphite iron). The matrix surrounding the graphite can be ferritic, pearlitic, or a mixture, depending on composition and cooling rate through the eutectoid range. You still use the same phase diagram principles: identify the phases present, apply the lever rule, and predict the matrix microstructure. The main difference is that graphite, not cementite, is the carbon-rich phase.
What are the practical limitations of the iron-carbon equilibrium diagram?#
The equilibrium Fe-Fe3C diagram assumes infinitely slow cooling with complete diffusion; in practice, faster cooling produces non-equilibrium phases like martensite or bainite, alloying elements shift boundaries, segregation creates composition variations, and the stable graphite system may override cementite in high-silicon irons, so TTT and CCT diagrams are needed for precise heat treatment design.
Key limitations:
- Cooling rate effects: Faster cooling suppresses diffusion, shifting transformation temperatures lower (undercooling) and producing non-equilibrium phases like martensite or bainite. The equilibrium diagram tells you what would form under infinitely slow cooling, which is why TTT (time-temperature-transformation) and CCT (continuous cooling transformation) diagrams are used for heat treatment design.
- Alloying element effects: Chromium, nickel, molybdenum, and other elements change phase boundaries. The diagram for a 4340 steel is not the same as for a plain carbon steel. Use the diagram as a qualitative guide, then refer to alloy-specific data.
- Segregation: In castings and welds, the last liquid to solidify is enriched in carbon and alloying elements. The local composition varies, so the phase diagram applies only to an average or local composition depending on the scale of interest.
- Metastable vs. stable: The Fe-Fe3C diagram is metastable. In high-silicon cast irons or after long annealing times, graphite forms instead of cementite, following the stable Fe-C diagram. Recognize which diagram applies to your alloy system.
Despite these limitations, the equilibrium diagram remains the standard starting point in metallurgical analysis. It defines the phases that compete to form, the driving forces, and the composition ranges where certain microstructures are possible. For engineers specifying materials, it explains why a 0.20% carbon steel cannot be hardened by quenching to the same degree as a 0.40% carbon steel, and why cast irons with different carbon equivalents have different as-cast strength and machinability. For a deeper dive into alloy selection, How to Read a Tensile Test Report and Material Data Sheet connects mechanical properties back to these microstructural origins.
How is the iron-carbon phase diagram used for heat treatment planning?#
Heat treatment planning starts with the iron-carbon phase diagram to select austenitizing temperatures: full annealing just above A3 or A1, normalizing above A3 or Acm, hardening by quenching from austenite, and spheroidizing just below A1. The carbon content from the diagram determines maximum attainable martensite hardness.
- Full annealing: Heat hypoeutectoid steels to about 30-50°C above A3; heat hypereutectoid steels just above A1 (not above Acm, to avoid a brittle cementite network on cooling). Hold, then furnace cool.
- Normalizing: Heat to roughly 50°C above A3 or Acm, then air cool. The faster cooling produces finer pearlite and a smaller grain size than annealing.
- Hardening (quench and temper): Austenitize at a similar temperature to normalizing, but quench to form martensite. The carbon content, read from the diagram, tells you the maximum attainable hardness. Martensite hardness increases with carbon content up to about 0.60%, after which retained austenite becomes a problem.
- Spheroidizing: Heat just below A1 for an extended period to globularize cementite in high-carbon steels, improving machinability.
For practical heat treatment procedures, see Steel Heat Treatment: Processes, Microstructures, and Properties.
Key takeaways#
- The iron-carbon diagram is a tool for predicting equilibrium phases, not final microstructures under all conditions, but it is the non-negotiable starting point.
- Master the eutectoid reaction at 727°C and 0.76% carbon; it divides all steels into hypoeutectoid, eutectoid, and hypereutectoid categories with distinct microstructural paths.
- Use the tie line and lever rule to calculate exact phase fractions in two-phase regions. Practice with a ruler on a printed diagram until it becomes automatic.
- Extend the same logic to cast irons by recognizing the eutectic reaction at 1148°C and the choice between the stable (graphite) and metastable (cementite) systems.
- Always consider the effects of alloying elements and cooling rate before making final predictions. The equilibrium diagram gives you the destination; TTT and CCT diagrams give you the route.